mSheet™ - you'll never look at the market the same way again.

MarketBrowser AE users get:
- Up to 100 Simultaneous Live Charts!
Monitor up to 100 stocks & studies in a single display! - Advanced Analytics!
Loaded with over 750 studies and functions!! - Comprehensive, Instant Research!
Just click on a chart & instantly pivot to hundreds of the best financial news, commentary & information sources! - mSheet™ Investments Scorebox!
Create a live investment scorebox summarizing key numbers & calculations pulled from your live stock charts - Back-Test with Conditional Analytics™!
Develop complex 'if-then' scenarios to evaluate & develop your investment strategies - Text, Trendlines, & Annotation!
Use the Drawing Toolbar to add custom trendlines, highlight areas of interest, apply text notations, & more - 30-Day, Risk-Free 100% Guarantee!
You'll agree that this is the most poweful research, monitoring & analytic tool of its kind—or your money back - and so much more...
Why Wait?
Get a year of MarketBrowser AE
Only $359
Less than
$29.95 per month!
Scorebox your investment - under $29.95 a month
It's a unique new analysis tool that does lightning fast calculations derived from your own live market charts. Put an easy spreadsheet-like face on your most complex calculations -- or just use it to create a watchlist. mSheet, the first spreadsheet in the world designed specifically for traders and analysts.

mSheet—the only tool of its kind in the world...
While the MarketBrowser AE itself is a true "spreadsheet for time series", it also includes the ability to place an mSheet™— within any MarketBrowser window. 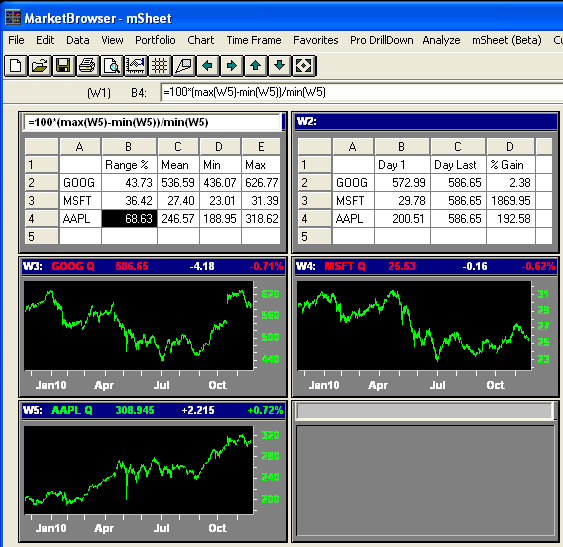
MarketBrowser AE - click to enlarge
What is an mSheet and what does it do which is special or different?
mSheet is the only computational spreadsheet in the world which has cell fomulas which are innately "time-series aware". This means that any cell in any mSheet in your MarketBrowser AE worksheet can have its value defined and continuously updated by operations performed on market time series anywhere in your worksheet. mSheet cells can "depend" upon, any data in any graph in your worksheet. Similarly, any graph in your worksheet can pick up and use values in any mSheet. In other words, mSheets can "get at" all of the values in the live charts which appear elsewhere in MarketBrowser -- and just as you'd expect, by using the same easy window number references (W1, W2, W3, etc.) you read about above. Likewise, any graph and a MarketBrowser AE window can have a formula which utilizes values located in cells within one or more mSheets. For example, in the image below, you can see that in window W1 the formula for mSheet cell B4 is:
=100*(max(W5)-min(W5))/min(W5)
In other words, mSheet can dynamically recompute the %range movement of AAPL as a percentage of its lowest value in Window W5, even as the high and low values in window W5 change. If we change the ticker in window W5, the mSheet in window W1 would adjust accordingly.
MarketBrowser AE - click to enlarge
mSheet was designed specifically for live and historical financial market data analysis— and allows you to create "smart" spreadsheets with cells which are fully aware of the market time series data you need to be on top of every day. Each mSheet cell has full "computational access" to all live and historical time series in your MarketBrowser worksheet.
So go ahead, Be Omniscient when you Get MarketBrowswer AE today.
mSheet and traditional spreadsheets --
similarities and differences
mSheet embraces the familiar experience of working with a spreadsheet and alloys this powerful concept to MarketBrowser's specialized facility in dealing with dynamic and deep historical market time series data. Make these formulae dynamic and instantaneously recalculate them based on live market data feeds and you have mSheet™. mSheets make your analysis more sophisticated, while making the calculation of results vastly speedier than is possible with traditional spreadsheets.
Is mSheet a replacement for my PC spreadsheet?
Absolutely not. mSheet utilizes the classic controls and user interface of a spreadsheet in order to give you an easy and familiar access to computations which could take you hours to get done with other tools, as well as providing a great tool to make easier than ever to set up custom market display screens, analytics scoreboxes and control panels for your strategies. However, mSheet has some deliberate design limits consistent with its mission. For example, mSheet is limited to 100 rows and 25 columns. Also, mSheet doesn't have a column "W" -- you will note that MarketBrowser uses W-references to enable you to create formulas referring to entire windows of data just by calling them W1, W2, etc. in your MarketBrowser formulas. A few more highlights for the technically inquisitive on mSheet's unique contributions to your daily work:- mSheets Understand Time Series—Spreadsheets Don't That's a BIG difference - If you want to divide Microsoft's stock history by Apple's stock history, and you're missing 1 data point, a spreadsheet can generate an error. A MarketBrowser mSheet (specifically designed for time series analysis) adjusts for the missing observation and generates the result you're looking for.
- A Vector Spreadsheet - Cells in a traditional spreadsheet each hold a single number, but a MarketBrowser mSheet cell can hold a stock's entire 10 year transaction history. If you add the price history of a second security to cell #2 and divide, you can instantly chart the price ratio of the 2 series and how it changed over time—a feat that would take millions of cells plus customized graphs in a traditional spreadsheet.
- Accelerated Real-Time Recalc™ (ARTReC™) MarketBrowser mSheets perform calculations on entire vectors of data instantly. These arrays can be comingled in calculations with mSheet cells in a way that is highly convenient for the user, and optimized for speed.
- mSheets Are Integrated with Your Data Feed - How do you find or dynamically recalculate the mean price of a currency or stock with over 2 million trades? With mSheet it is so easy to do. Pull the instrument's history into a MarketBrowser AE chart window -- say Window 1 (W1), click on an mSheet cell and type =MEAN(W1), and the answer will be looking right at you --instantly. Need to find all the peaks above a certain price threshold? You're just a few clicks and keystrokes from the answer.
Have you been giving away your advantage?
Never invest at a disadvantage again! For 20 years, Leading Market Technologies has worked with the world's top investment firms to create best-of-breed software for researching, analyzing, & monitoring securities. By 2001, our solutions were being used by over 80% of the world's large banks and investment banks. Now this expertise has been packed into new, easy to use, affordable MarketBrowser AE—making investment research & analysis easier than ever before. With its 30-Day, 100% Risk-Free Guarantee, you're guaranteed to LOVE MarketBrowser AE—or your money back. Beat the competition to the opportunities as your software helps you make decisions that are faster, easier, and more powerful. For years, the big guys have had access to tools that you didn't. Now MarketBrowser AE puts the ball back in your court for only $29.95 per month. Get your advantage back today.