Institutional-level Stock Analysis for under $29.95 per month!

MarketBrowser AE users get:
- Up to 100 Simultaneous Live Charts!
Monitor up to 100 stocks & studies in a single display! - Advanced Analytics!
Loaded with over 750 studies and functions!! - Comprehensive, Instant Research!
Just click on a chart & instantly pivot to hundreds of the best financial news, commentary & information sources! - mSheet™ Investments Scorebox!
Create a live investment scorebox summarizing key numbers & calculations pulled from your live stock charts - Back-Test with Conditional Analytics™!
Develop complex 'if-then' scenarios to evaluate & develop your investment strategies - Text, Trendlines, & Annotation!
Use the Drawing Toolbar to add custom trendlines, highlight areas of interest, apply text notations, & more - 30-Day, Risk-Free 100% Guarantee!
You'll agree that this is the most poweful research, monitoring & analytic tool of its kind—or your money back - and so much more...
Why Wait?
Get a year of MarketBrowser AE
Only $359
Less than
$29.95 per month!
Over 750 Studies & Functions and So Much More
It's the most powerful stock analysis software available outside of a capital markets firm—Guaranteed. Get tons of technical studies plus hundreds of math, analytic & programming functions PLUS trend-lines, annotation, the mSheet™, correlation matrices, and unlimited comparisons—all for under $29.95 per month!
Use the Tools the Pros Are Using
MarketBrowser AE: 100 Live Charts -- the world's only Spreadsheet for Time Series
MarketBrowser AE's powerful analytics take your analysis to new levels. First, MarketBrowser is a unique "spreadsheet for time series" in which each individual chart window can contain a formula ranging from the most basic to the ultimately complex -- formulas which you define. Imagine having the freedom to enter formulas like you would in a spreadsheet, but for live market charts. Well that's precisely what you can do in MarketBrowser AE.
How does it work?
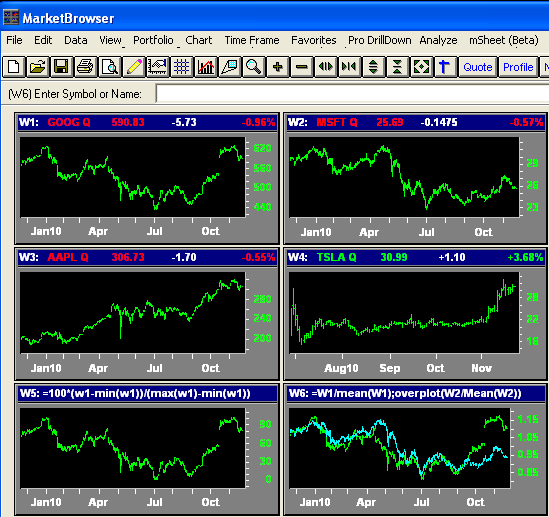
It's so simple. In the worksheet below, you can see how each window has the letter "W" followed by a number. That is the "handle" which you use to refer to the chart in that window to do computations. In window 5 (W5) you can see a user's fomula, which gives the percentage of range for any stock placed in window 1 (W1). Here's the formula for window W5:
=100*(w1-min(w1))/(max(w1)-min(w1))

MarketBrowser AE - click to enlarge
=W1/mean(W1);overplot(W2/Mean(W2))
This formula normalizes the stocks in both windows W1 and W2 to their respective means, and overplots them in window W6. In MarketBrowser, of course all window formulas update automatically with each new market tick in an underlying instrument.
mSheet: Another world's first and only
While the MarketBrowser itself is a true "spreadsheet for time series", MarketBrowser AE also includes the ability to place an mSheet™— within any MarketBrowser window.What is an mSheet and what does it do which is special or different?
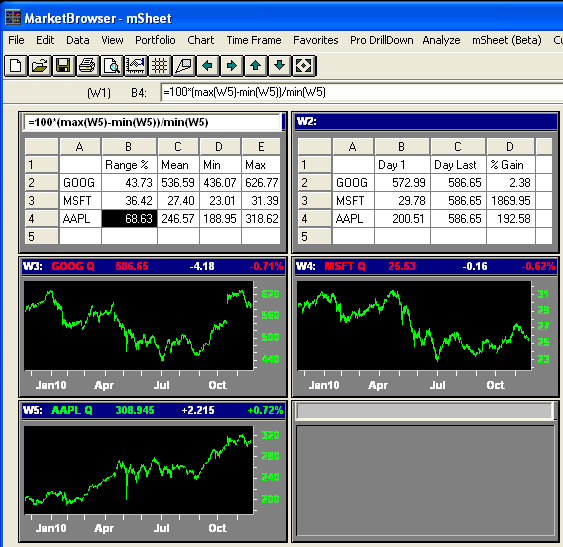
mSheet is the only computational spreadsheet in the world which has cell fomulas which are innately "time-series aware". But they're not just aware of time series, they are aware of every live and historical financial market time series in your MarketBrowser worksheet. In other words, mSheets can "get at" all of the values in the live charts which appear elsewhere in MarketBrowser -- and just as you'd expect, by using the same easy window number references (W1, W2, W3, etc.) you read about above. For example, in the image below, you can see that in window W1 the formula for mSheet cell B4 is:
=100*(max(W5)-min(W5))/min(W5)
In other words, mSheet can dynamically recompute the %range movement of AAPL as a percentage of its lowest value in Window W5, even as the high and low values in window W5 change. If we change the ticker in window W5, the mSheet in window W1 would adjust accordingly.

MarketBrowser AE - click to enlarge
mSheet was designed specifically for live and historical financial market data analysis— and allows you to create "smart" spreadsheets with cells which are fully aware of the market time series data you need to be on top of every day. Each mSheet cell has full "computational access" to all live time series in your MarketBrowser worksheet.
So go ahead, Be Omniscient when you Get MarketBrowswer AE today.
700 Built-In Math, Analysis, & Program Functions
Make stock & investment analysis faster & more effective with MarketBrowser AE. Over 700 functions are built right into the software. It takes seconds to produce top quality, custom analytics that would have taken engineers to create in the past. MarketBrowser AE includes:
|
|
|
|
Get the Ultimate Stock Analysis Tool & Get 700 Functions for less than $29.95 per month now! |
||
Combine Functions and Studies & Create Unlimited Custom Analytics:
Mix and match the standard built-in functions and studies to create custom analytics allowing you nearly limitless power. Custom analytic applications include:
|
|
|
|
Add Custom Analytics to your Tool-Kit - Get MarketBrowser AE for less than $29.95 per month now! |
||
Technical Analysis and Technical Studies:
MarketBrowser AE comes out of the package all the technical studies you would expect -- accessed via simple, point & click menus for applying tons of pre-defined classic technical studies directly to stocks or indices, or to your own custom computed indicators and charts. As your charts update themselves with current quotes, your studies are updated automatically. Of course one of the great strengths of MarketBrowser AE is the ability to create your own studies and reuse them again and again. "Canned" studies include:
|
|
Trendlines, Resistance Lines, & Annotation
See what you need to see (or show what you need to show). Applying automatically calculated trendlines to your data is only a dropdown menu away. Annotate your charts with flexible text additions which are smart enough to pull updating data from your time series. Define thresholds with horizontal, vertical, or segmented lines. Set alarms to notify you when lines are crossed. Even add Support and Resistance Lines in just a few clicks, including:
|
|
|
Conditional Time Series Analysis, Dynamic Marking & Feature Extraction Analytics
MarketBrowser AE allows you to create mark/show conditions for time series, and then lets you use those custom defined triggers to generate dynamic, analyzable new series based on those conditions. These conditions can be built into sophisticated formulas and charts for back testing your trade strategies. Complex conditions in the market environment can be co-mingled with single series conditions to identify and mark each instance of a user-defined trigger event. For example, you could mark each instance of a security's moving average crossover on its graph. You could then use these marks to chart buy/sell signals as a series in a new window. Then perform sophisticated analytics on the resulting series. You could, for exapmle, calculate the security's profit and loss over time based on a buy/sell strategy you define!
Get Mark/Show Analysis Today - Get MarketBrowser AE Now!
mSheet
Take the familiar experience of working on a spreadsheet and add to it MarketBrowser's specialized, split-second rapidity in analyzing, extrapolating, and manipulating multiple, million-data-point time-series. Then make these formulae dynamic and base them on live data feeds and you have a mSheet™. mSheets make your analysis more sophisticated, while making the calculations several steps quicker than traditional spreadsheets. Just a few highlights of working with mSheets:
- mSheets Understand Time Series—Spreadsheets Don't - That's a BIG difference - If you want to divide Microsoft's stock history by Apple's stock history, and you're missing 1 data point, a spreadsheet can generate an error. A MarketBrowser mSheet (specifically designed for time series analysis) adjusts and generates the result you're looking for.
- Vector Spreadsheeting - Cells in a traditional spreadsheet each hold a single number, but a MarketBrowser mSheet cell can hold a stock's entire 10 year transaction history. If you add the price history of a second security to cell #2 and divide, you can instantly chart the price ratio of the 2 series and how it changed over time—a feat that would take millions of cells plus customized graphs in a traditional spreadsheet.
- Accelerated Real-Time Recalc™ (ARTReC™) - Traditional spreadsheets were designed for accountants—not traders. MarketBrowser mSheets perform sophisticated vector calculations on multiple series instantly. When it's time to crunch the big numbers, mSheet gets it done while your spreadsheet is still at the starting gate.
- mSheets Are Integrated with Your Data Feed - How do you find the mean price of a stock over 2 million trades? With a spreadsheet, you find the data, export it , hope the spreadsheet has enough rows to import it, select 2 million cells & find the mean. With mSheets it's easy. Put the stock in Window #1 (W1), go to your mSheet, type =MEAN(W1), and the answer is calculated instantly.
Get MarketBrowser AE Today & Get mSheet Power! less than $29.95 per month!
Have you been giving away your advantage?
Never invest at a disadvantage again! For 20 years, Leading Market Technologies has worked with the world's top investment firms to create best-of-breed software for researching, analyzing, & monitoring securities. By 2001, our solutions were being used by over 80% of the world's large banks and investment banks. Now this expertise has been packed into new, easy to use, affordable MarketBrowser AE—making investment research & analysis easier than ever before. With its 30-Day, 100% Risk-Free Guarantee, you're guaranteed to LOVE MarketBrowser AE—or your money back. Beat the competition to the opportunities as your software helps you make decisions that are faster, easier, and more powerful. For years, the big guys have had access to tools that you didn't. Now MarketBrowser AE puts the ball back in your court for only $29.95 per month. Get your advantage back today.
