MarketBrowser Tutorial #8 -
Correlation Matrix
Don't forget about the advanced analytics available in the 'Analytics' menu. Possibly the most powerful of these is the Correlation Matrix. How diversified are you really? Do the stocks and funds you own tend to move together? Can you find a leading/lagging relationship between several securities? The Correlation Matrix may be able to help you.
What is a Correlation Matrix
Basically, the correlation between two stocks calculates their historical tendency to increase or decrease together. Correlation ranges from 1 (100% correlation) to 0 (completely uncorrelated behavior) to -1 (100% inverse correlation). But that's just the basics. MarketBrowser Advanced Edition's Correlation Matrix can take bunches of instruments (5, 10, 20 stocks or more) and return a matrix depicting how they each correlate to one another. So if you hold positions in 15 stocks in different industries, but your correlation matrix reveals high correlations—you may not be as diversified as you think!
How to Use the Correlation Matrix
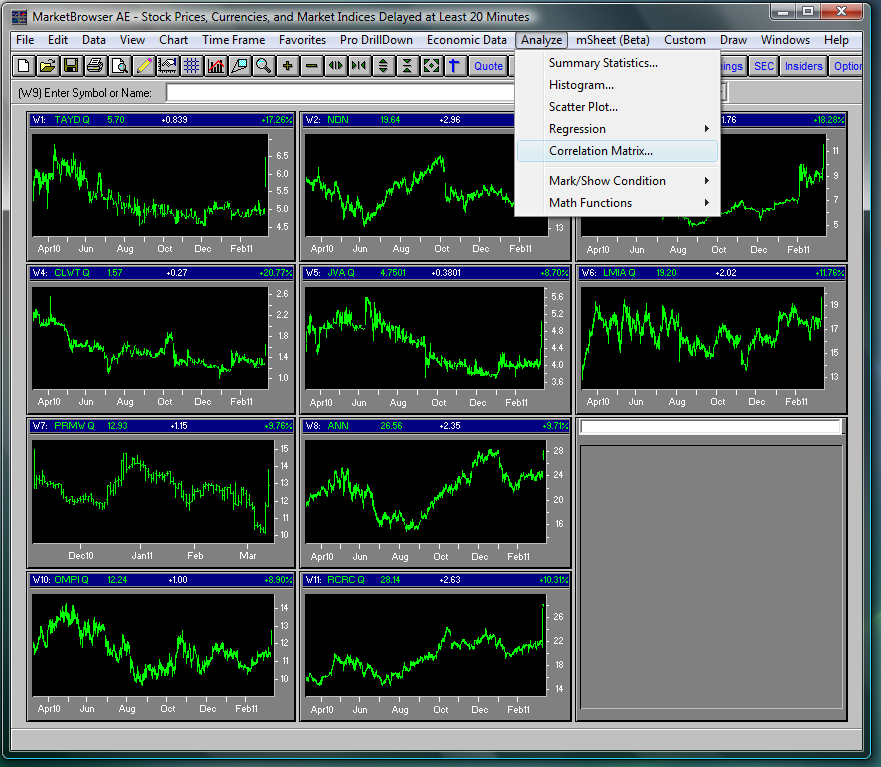
The Correlation Matrix is surprisingly easy to use for so powerful an analytical tool. First, enter the securities or data you want to correlate. Here we've picked 10 of the movers that happened to do well on a given day, selected an empty window, and then opened the 'Analyze' menu to get to the 'Correlation Matrix'.
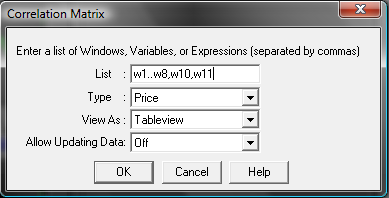
In the dialogue box we enter the windows we'd like correlated:
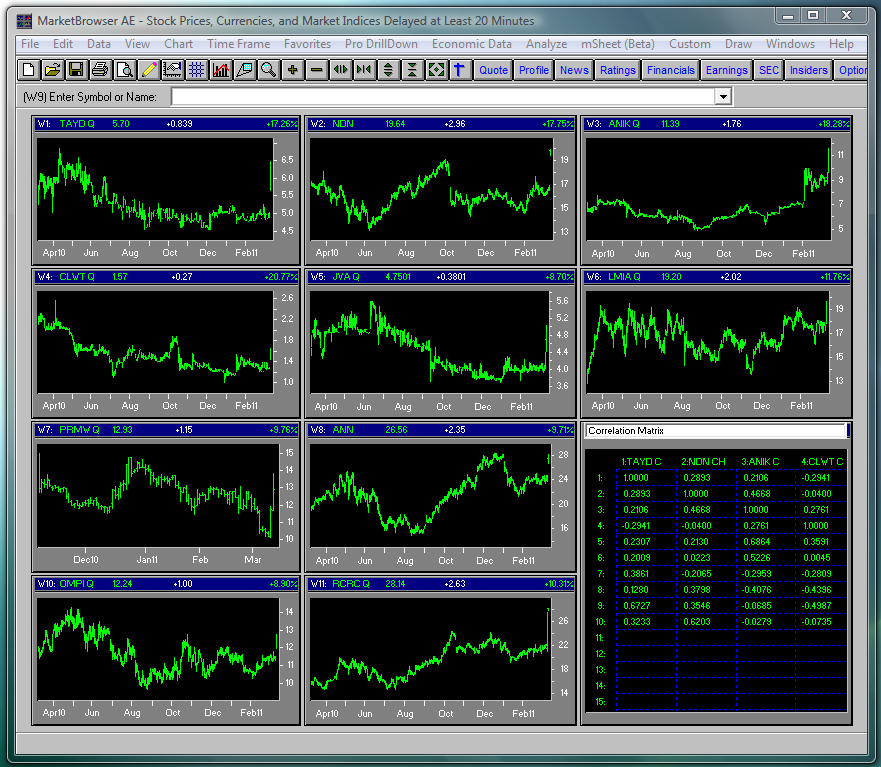
And a table marking the correlations is generated!
Are your stocks as diversified as you thought they were? Do your mutual funds have overlapping holdings you weren't aware of? Can you use the Correlation Matrix to identify patterns of correlated stocks to help improve your investment decisions? With MarketBrowser AE, now you can find out!
Thank you for reading...
We hope you have enjoyed this MarketBrowser AE tutorial. If you have suggestions or topics you would like to see, please contact us.
Welcome to the MarketBrowser family!
Warmest Regards,
The MarketBrowser Team
PS. Please help us improve these tutorials!
Take 3 minutes to tell us what you thought...
|