MarketBrowser Tutorial #5 -
Build Your Own Analytics
You won't see THIS on any web site...
In this Tutorial, we are delighted to highlight capabilities unique to MarketBrowser's desktop application. You won't see them at any website because they don't happen there. They happen in your imagination and then on your computer.
1. How Do I Create My Own Formulas?
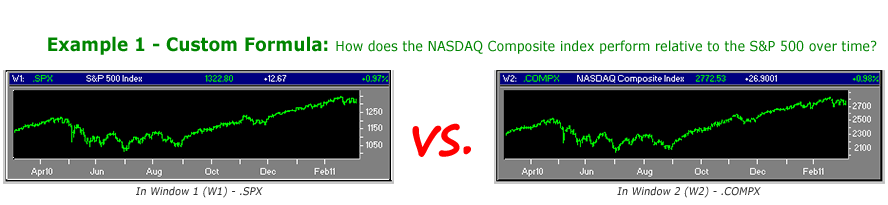
MarketBrowser enables you to define your own custom formulas and then chart them instantly. For example, you can enter a formula to view the relative behavior over time of the S&P 500 (.SPX) and the NASDAQ Composite (.COMPX).
To input this formula:
- First select the window in which you want to see the resulting chart.
- Next click to the white formula bar (where it says 'Enter Symbol or Name:')
- Type the algebraic relationship to display using the appropriate window numbers* (W1, W2,...) to reference each chart.
- Press 'Enter' to chart your custom formula
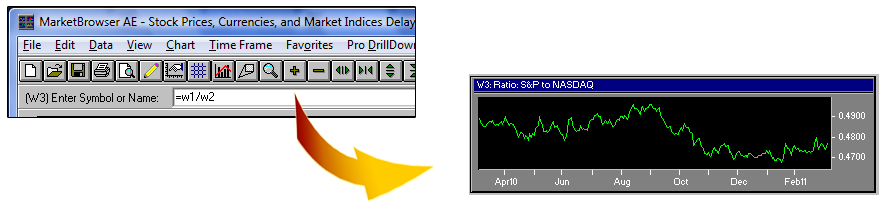
So for the example above, if .SPX is in W1 and .COMPX is in W2, then typing "=W1/W2" into W3 will produce the chart displayed below (right).
The chart to the upper right reflects the relative appreciation or depreciation of the S&P 500 compared to the NASDAQ Composite over a period of time (one year in this example). Note that in the example picture, we also gave the 3rd window a descriptive name using the Right-Click 'Custom Label' option.
*Note: When building custom formulas, you may wish to first display window numbers for convenience's sake. Display window numbers by clicking the menu option: 'View' -> 'Window Numbers'. The window numbers will then appear in the upper left corner of each window/chart.
2. Use Custom Formulas to Build Your Portfolio
You can use custom formulas to track your portfolio using actual positions. For example if W1 shows General Electric (GE), W2 shows Microsoft (MSFT) and W3 shows Johnson & Johnson (JNJ), the following formula will chart the value of a portfolio containing 75 shares of GE, 50 shares of Microsoft and 25 shares of JNJ.
In the pictures below, we've selected Window 4 and entered our portfolio using this formula. The resulting chart is pictured below as well! Note that the default label indicates the custom calculation. Again, use the 'Custom Label' option from Right-Clicking a chart to enter your own title.
3. Advanced Formulas
We've used only the simplest functions to generate the examples above. MarketBrowser AE actually includes Over 700 Math & Program Functions which can be used to build limitless analytics. Check out the full selection of functions at our Online AE Functions Guide!
If you're big into building your own custom analytics, make sure you also check our our Appendix F, which shows you how to Increase Your Speed & Power With Macros. Use Macros to save & name custom functions that you use frequently, or more importantly, to stack custom functions within custom functions—really opening your analysis up to ANYTHING!
Thank you for reading...
We hope you have enjoyed this MarketBrowser AE tutorial. If you have suggestions or topics you would like to see, please contact us.
Welcome to the MarketBrowser family!
Warmest Regards,
The MarketBrowser Team
PS. Please help us improve these tutorials!
Take 3 minutes to tell us what you thought...
|