|
Tutorial 1 |
Tutorial 2 |
Tutorial 3 |
Tutorial 4 |
Tutorial 5 |
Tutorial 6 |
Tutorial 7 |
Tutorial 8 |
Tutorial 9 |
Tutorials Index
MarketBrowser Tutorial #1 -
|
1. Entering a Ticker SymbolThe easiest way to create a live chart is to simply click on a window and type in a ticker symbol. Presto! Your live chart will appear. Your chart will updated regularly & frequently, without your having to press a refresh button! (Prices are delayed at least 1 day in this version of MarketBrowser) To speed things up, you can type in multiple symbols and separate them with a comma (e.g. "GOOG, IBM, DELL"). Hit return and charts for all your symbols will appear. If you do not know the ticker symbol for the security you would like to see, you may use MarketBrowser's lookup tool. Simply type the name of the company (e.g. Hewlett Packard). MarketBrowser will give you a list of possible tickers from which you can choose. |
 |
2. Reading Your Charts
To the above right, we've displayed an example of a MarketBrowser chart showing the NASDAQ Composite.
The market monitor is the dark blue line at the top of the window. In this picture it displays (left to right) the ticker symbol (.COMPX), the latest price (2066.19), the change between the latest price and the previous day's close (+12.73) and the percentage change between the latest price and the previous day's close (+0.61%). MarketBrowser will display these numbers in green for upward movement, red for a downward movement and white for an unchanged price. In Appendix A: Customize Your MarketBrowser, we'll show you how to edit this bar to display different information.
3. Zoom a Chart
You can double click a chart to zoom it up and use the 'Esc' key on your keyboard to unzoom. Or click the ![]() toolbar button to zoom and unzoom the active chart.
toolbar button to zoom and unzoom the active chart.
4. Chart Historical Economic Data
With MarketBrowser you can also chart and manipulate economic data—from interest rates to GDP to unemployment rates—as simply and conveniently as you would a stock or a mutual fund. Data is provided by the St. Louis Federal Reserve and is publicly available on their web site. As an example shown below are two charts displaying economic data for the 'Civilian Unemployment Population Ratio' and the 'Bank Prime Loan Rate' respectively.
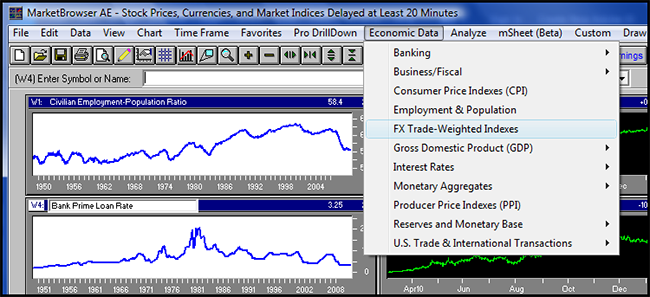
To access economic data in MarketBrowser, just click on the 'Economic Data' menu option and select your economic category of interest. Then you'll get another window displaying the specific economic data series available. Select your desired economic data series to have it charted.
For questions on the data (calculation, timeliness...) please refer to the St. Louis Federal Reserve web site: www.stls.frb.org.
5. MarketBrowser System Tray Icon - Always There For You
 The system tray icon (right) is always visible when MarketBrowser is running, and shows the percent change for the stock or index in MarketBrowser's Window #1. MarketBrowser has been designed to be very light, which means your charts remain only a click away at all times. When you start up your PC, or when you X out of other MarketBrowser views, the MarketBrowser icon will appear in your System Tray. Just click on the icon to expand your view and see all the charts you're following.
Thank you for reading...
We hope you have enjoyed this MarketBrowser AE tutorial. If you have suggestions or topics you would like to see, please contact us.
Welcome to the MarketBrowser family!
Warmest Regards,
The MarketBrowser Team
 |
|
PS. Please help us improve these tutorials!
Take 3 minutes to tell us what you thought...