MarketBrowser Tutorial #7 -
Conditional Analytics™ & Back-Testing
This tutorial introduces you to MarketBrowser's Conditional Analytics. Conditional Analytics allow you to define thresholds or conditions and then allows you to use these conditions to build sophisticated analytics. A simple example: you can easily mark a chart with every area where its value exceeds a number you define. Or, alternatively, you can show each spot where that stock price crosses that threshold.
How do Conditional Analytics™ Make My Life Better?
You can get into much more sophisticated analysis by using Conditional Analytics to explore hypotheticals. Below is a relatively simple step-by-step example. We use Conditional Analytics™ to back-test a basic mean reversion strategy. We create buy/sell conditions based on a MarketBrowser AE technical study (the volatility index). Then we generate a series of extrapolations based on hypothetical buys & sells triggered when .GOOG crosses a condition. Watch how profits are instantly calculated as we apply the trade rule to Google's stock price.
Example: Back-Test a Strategy with Conditional Analytics™
Full Display - This is what your end result will look like
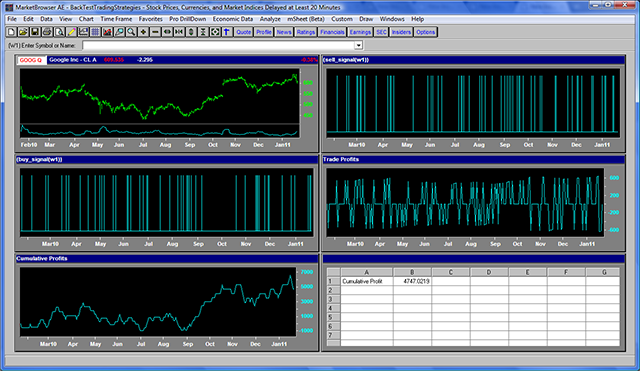
Full Display (above): Here, we have completed a back-test for a potential trade strategy. Below are window-by-window zoomed images with detailed explanations for building this analysis.
1st Window - (Zoomed - Upper Left Window)
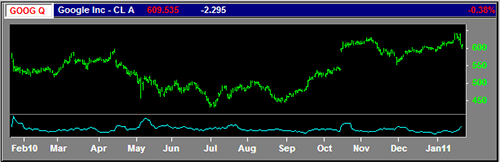
W1 (above) - Google Volatility: Here we've charted Google's Stock Price in green and then over-layed its volatility index (with a boxcar of 6) as the cyan line below it.
2nd Window - (Zoomed - Upper Right Window)
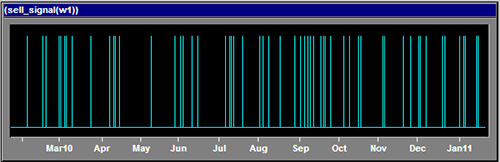
W2 (above) - Selling Rule: In this example we sell on days when the current price is greater than yesterday's price plus half of the volatility index. In Window 2 we mark days that fulfill this condition.
*note: this formula can be found in our detailed instructions
3rd Window - (Zoomed - Middle Left Window)
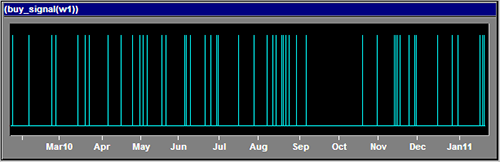
W3 (above) - Buying Rule: Here we've charted our buy signals - in this case we buy on days when the current price is less than yesterday's price minus half of the volatility index.
*note: this formula can be found in our detailed instructions
4th Window - (Zoomed - Middle Right Window)
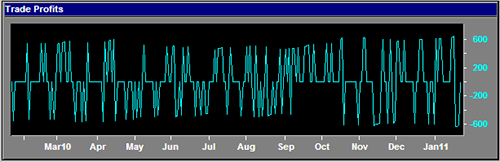
W4 (above) - Trade Profits: Now things are getting interesting! Window 4 pulls & charts the profits and losses for each individual trade conditionally triggered by signals in windows 2 & 3.
5th Window - (Zoomed - Lower Left Window)
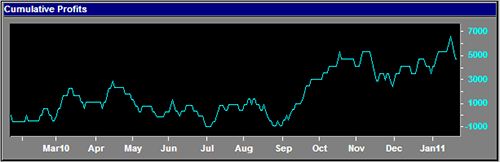
W5 (above) - Cumulative Profits: Here's the payoff. In Window 5 we total the results calculated in window 4 to display the cumulative profit and losses resulting from our potential trade strategy.
6th Window - (Zoomed - Lower Right Window)
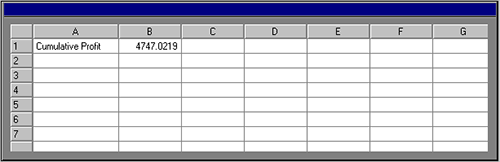
W6 (above) - mSheet™ Investment Scorebox: Here we're using MarketBrowser AE's mSheet™ to pull a live result number from Window 5 ($4747 cumulative profit!). This number will update as data changes. And although we're pulling only 1 number here, mSheet can hold hundreds of live stats at a time!
Final Result - After building the test, your display should look something like this
Final Result (above): Presto! It took a few minutes to build each of those windows, but now you've got a fully developed analysis above! Save it as a worksheet for future use, or change the stock in W1 to view the strategy applied to different stocks!
Taking Conditional Analytics to the Next Level
Conditional Analytics™ are fast, easy, and effective! The example above is actually a remarkably simple one. Take the work above, and with just a few clicks you can also:
- Replace security with other tickers
- Vary the time-period being tested
- Alter Conditional Trade volumes triggered by the trade rules
- Greatly increase the sophistication of your trade conditions
This was a brief overview of Conditional Analytics. For more information about taking your analysis to the next level, we suggest you check out:
Thank you for reading...
We hope you have enjoyed this MarketBrowser AE tutorial. If you have suggestions or topics you would like to see, please contact us.
Welcome to the MarketBrowser family!
Warmest Regards,
The MarketBrowser Team
PS. Please help us improve these tutorials!
Take 3 minutes to tell us what you thought...
|