MarketBrowser Tutorial #4 -
About Technical Studies in MarketBrowser
MarketBrowser provides many powerful investing tools. The better you understand them, the more effective your MarketBrowser experience. In today's tutorial we introduce you to the plethora of menu-driven technical studies available in MarketBrowser AE. These options allow you to effortlessly apply most of the popular technical studies to whatever charts you'd like.
1. What is a Technical Study?
Technical studies are mathematical operations performed on stock and mutual fund prices. They may provide investors with useful tools to analyze data. Technical studies can be used to consider different factors like average price over time and traded volume. MarketBrowser offers many common technical studies, including: Moving Averages, Bollinger Bands, and Volatility. We'll discuss each of these in depth later in the series.
At the end of this tutorial, we'll list several of the technical studies available in MarketBrowser AE, but if you're interested in technical analysis, we really encourage you to check out the full list of studies at our comprehensive, online AE Technical Studies Guide.
2. MarketBrowser & Technical Studies
MarketBrowser supports a wide range of studies (technical indicators) which you can apply to your charts (see the full list of studies here). You can familiarize yourself with the functionality and other technical studies available by navigating through the major indicator categories:
- Moving Average
- Bands
- Channels
- Oscillators
- Directional Movement
- Price Volume Studies
- Volatilities and Correlations
- Indicators
- Support and Resistance
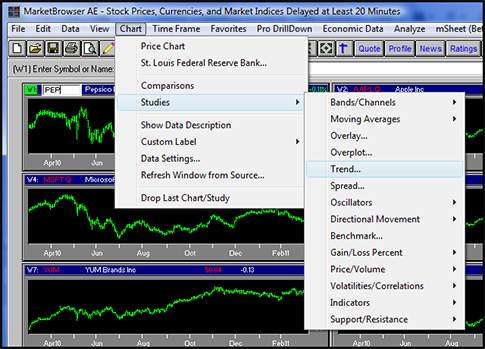
3. Steps For Adding Technical Studies:
- First, select the chart you wish to add a study to.
- Next, click on the 'Chart' pulldown menu.
- Then choose a study category.
- Lastly, select the desired study.
4. Removing a Study
To remove a study or comparison once it's been added you can use the bottom option under the chart menu (shown above): 'Chart' -> 'Drop Last Chart/Study'. This is a first-in-last-out operation, meaning that each click of this menu option will remove the last study/comparison that was added. Thus if you wish to remove the 2nd to last study you added you'll need to click 'Drop Last Chart/Study' twice and then re-apply the last study.
Note: When adding or removing studies and comparisons you are only working with the active chart. The active chart can be identified because its symbol in the will be highlighted. In the image above a green highlight can be seen surrounding the ticker symbol .PEP in the top leftmost chart.
5. Taking it to the Next Level
MarketBrowser AE has a huge array of technical studies available to you. This tutorial just gave you an overview for where to find them and how to apply them, but more information is available to you. Check our comprehensive list of MarketBrowser studies (including definitions for each study) online at our AE Technical Studies Guide. Or if you'd like to build your OWN analytics, MarketBrowser Advanced Edition is here to help with that too. Learn the basics of rolling your own analytics in Tutorial #5.
Thank you for reading...
We hope you have enjoyed this MarketBrowser AE tutorial. If you have suggestions or topics you would like to see, please contact us.
Welcome to the MarketBrowser family!
Warmest Regards,
The MarketBrowser Team
PS. Please help us improve these tutorials!
Take 3 minutes to tell us what you thought...
|