|
Tutorial 1 |
Tutorial 2 |
Tutorial 3 |
Tutorial 4 |
Tutorial 5 |
Tutorial 6 |
Tutorial 7 |
Tutorial 8 |
Tutorial 9 |
Tutorials Index
MarketBrowser Tutorial #3 -
|
|
Standard ~ Conforms all compared securities to use the original's price axis. This is done by scaling the price at the beginning of the time range used to match that of the original security and then applying the same calculation to all subsequent prices. All compared securities will appear in one chart using the same price axis. |

|
|
Overlay ~ All the securities compared will be displayed in a single chart's graphing area. However, a new price axis and independent scale will be created for each comparison added. Thus, unlike the Standard comparison, you can't get a quick visual idea of how the securities are performing comparatively. |

|

|
Above/Below ~ This is a less common comparison method which will insert compared securities at the bottom of a chart as a sub-chart. Each sub-chart will have an independent price axis and graph area. Also, you're limited to adding a total of four sub-charts (which doesn't include the original chart). |
2. How do I Change a Chart's Time Frame and Periodicity?
When creating new charts in MarketBrowser you will receive, by default, one year of daily data for each security. If you care to change the time range or periodicity of data, first select the chart of interest by clicking on it. Next, go to the 'Time Frame' menu and select the desired time range for your chart. From this menu you can also change periodicity for your chart from daily to 10 minute intervals. Stay tuned for more advanced periodicity options to be added to MarketBrowser AE soon!

If you select "All Dates" as the Time Frame of your Chart, you will retrieve all the data that is available to MarketBrowser for the desired stock, fund or index. MarketBrowser currently doesn't provide data prior to January 1998. As such if the security you're charting started trading before this date "All Dates" will return price data from 1998 forward.
3. How do I Create Price/Volume Charts?
MarketBrowser makes accessing price/volume charts (or alternatively charts of just volume data) extremely easy.
- First click on the chart you wish to add volume data to (to make it the active chart)
- Then open the menu: 'Chart' -> 'Studies' -> 'Price/Volume' (shown below).
- Select 'Price/Volume Chart'
- Presto! Your volume chart is added beneath your price chart!
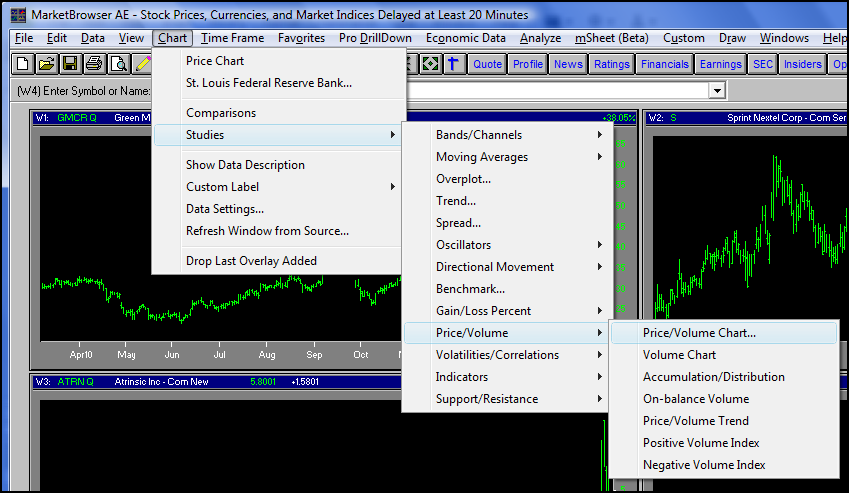
As you can see in the image above, you can also use the menu option, 'Volume Chart', to create a chart with only volume data (no price data).
Thank you for reading...
We hope you have enjoyed this MarketBrowser AE tutorial. If you have suggestions or topics you would like to see, please contact us.
Welcome to the MarketBrowser family!
Warmest Regards,
The MarketBrowser Team
 |
|
PS. Please help us improve these tutorials!
Take 3 minutes to tell us what you thought...