|
Tutorial 1 |
Tutorial 2 |
Tutorial 3 |
Tutorial 4 |
Tutorial 5 |
Tutorial 6 |
Tutorial 7 |
Tutorial 8 |
Tutorial 9 |
Tutorials Index
MarketBrowser Appendix A -
|
 |
|
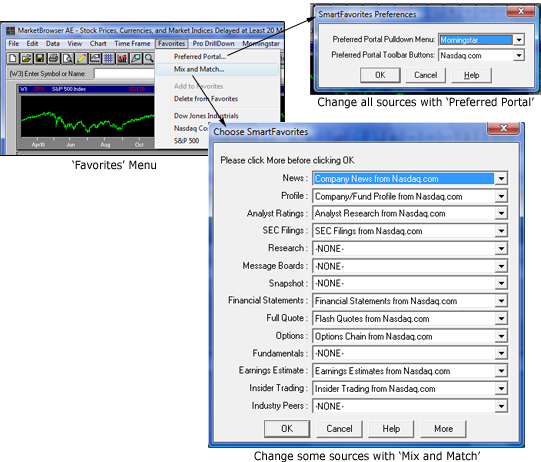
2. Select Your Favorite Symbols
MarketBrowser AE allows you to save stock, fund, metals, currencies, ETFs, and index names as favorites. To add a symbol to your favorites, just right-click a chart and select 'Add to Favorites'. Then, when you want to chart one of your favorites, pull down the 'Favorites' menu and make your selection. MarketBrowser will then add this to the active chart.

3. Alter Your Charts
MarketBrowser lets you toggle easily between different charting styles. The following picture shows 'Graph Style' toolbar button; displayed as a red line over a black histogram.

Clicking this button will toggle your chart between a line representation, traditional bars, Japanese candlesticks and a tabular view (which shows the actual numerical values instead of a chart).
You can also use:
- The 'Grids' button -
 - to change the gridlines on the chart
 - The 'Axes' button -
 - to adjust the layout of the chart axis labels
 - or The 'Drawing Toolbar' button -
 - to add trend-lines, text, or other annotation to your chart.
4. Manage Your Layout
MarketBrowser AE gives you plenty of control over your layout. Manage your layout with the 'Windows' menu items (or shortcut to many of these options by right-clicking the mouse):

Add Windows/Monitors... ~ Use to add windows/monitors to your worksheet (increasing total number of charts). New windows are inserted after the active chart.
Delete Windows/Monitors... ~ Use to delete windows/monitors from your worksheet (reducing total number of charts). Windows are removed starting with the active chart.
Display... ~ Enter a list of charts you wish to display, thus hiding (not deleting) all others and allowing you to concentrate on those still visible. Use a comma to separate windows, and .. to include windows between 2 numbers. For Example: "W1,W5..W8" will display windows W1 and also W5 through W8 and hide all others.
Display All ~ Use to displays all charts; showing any that were previously hidden.
Clear Window ~ Empty the chart out of the active window only.
Clear All ~ Empty the charts out of all windows in your worksheet.
Tile ~ Automatically adjusts the number of rows and columns to best fill the worksheet space and leave as little empty space as possible. You'll only see an effect if your current worksheet setup leaves unused space in the lower right corner.
Arrange ~ Will fill any left over worksheet space by expanding a nearby window/chart into the empty space.
Columns... ~ Allows you to set/change the number of columns in your worksheet layout. You can choose to have between 1 and 8 columns.
Zoom/Unzoom ~ This option allows you to change between a multi-chart (unzoomed) display and a single chart (zoomed) display of the active window.
Auto Legend ~ Enables you to activate/deactivate the legend on a per chart bases. The legend will appear in the top left corner of zoomed charts displaying the current day's price information.
5. Change Your MarketBrowser AE Preferences
MarketBrowser can be customized in many ways to suit your needs and preferences. The main choices governing settings are accessible from the 'File' -> 'Preferences' menu options. The following choices, as displayed in the screenshot, are available to customize your MarketBrowser settings.

- Startup... ~ Control the startup behavior of MarketBrowser: auto load last worksheet used, auto refresh worksheets when opened, set number of charts in new worksheets, auto-start MarketBar in addition to system tray icon.
- Monitors... ~ Control the format of market monitors: what fields to display, monitor coloring settings, show or hide the window/chart numbers (more info below).
- Auto Legend... ~ Control when the chart legend is displayed if it's turned on for the current chart.
- Printing... ~ Control printing defaults. Choose black and white or color printing and what parts of a window/chart get printed.
- Data Retrieval Defaults... ~ Control the default data retrieval options, notably the data fields and time frame used.
- Clickover... ~ Control when web link clickovers will open a new web browser window.
- Email Address... ~ Change your email address (used when sending questions to us from within MarketBrowser).
- Advanced... ~ Used to address connectivity issues (recommend not to change unless request by our technical support).
- Shutdown... ~ Choose whether MarketBrowser should auto-save worksheets when shutting down computer without first closing MarketBrowser.
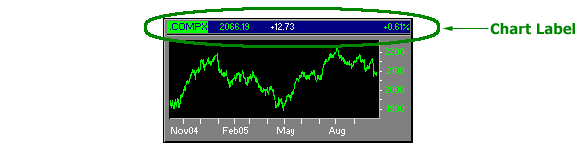
6. Customize Your Chart Labels
Your Chart Label is the dark blue title bar at the top of each chart.
You can customize this label in MarketBrowser AE. To customize Chart Labels, simply navigate to the menu option: 'File' -> 'Preferences' -> 'Monitors...' which will bring up the dialog box displayed below (right). Notice the 3 Monitor Label Settings:

Label Style:
This option allows you to control which information fields are displayed or hidden in the market monitor. The menu option shows the titles of the fields displayed from left to right. So the fields displayed in the .COMPX image above are those selected in the Label Style. From left to right they are:
- Ticker Symbol: .COMPX (field name: Sym)
- The Latest Price: 2066.10 (field name: Price)
- The Price Change Since Yesterday's Close: +12.73 (field name: Change)
- The Percent Change Since Yesterday's Close: +.061% (field name: %Change)
The three dashes in the Label Style image right-justifies the field that comes after it (in this case, the %Change). Other information you can display or hide are:
- Data Fields: typically CHLO i.e. close, high, low and open (field name: Field)
- Periodicity: i.e. '3 Month', 'YTD', '1 Year'... (field name: TimeFrame)
Color in Label:
Prices climb and the information on the label turns green. They fall, and you'll see red. Stay even and white text will rule the day. This option lets you choose which items on the bar are color coded:
- "Color Entire Label" - All monitor items gets colored based on price movement.
- "No Color in Label" - All monitor items remain white at all times.
- "Color Some of Label" - Only some monitor items get colored (default).

Window Numbers:
Turning the window numbers on (e.g. "W1") can be helpful when building custom formulas, but sometimes you want them off. Use this option to hide or display the window numbers!
- "Always Hide" - Window numbers are always hidden (default).
- "Display when in Charts View" - Window numbers are shown only when in Charts view.
Thank you for reading...
We hope you have enjoyed this MarketBrowser AE appendix. If you have suggestions or topics you would like to see, please contact us.
Welcome to the MarketBrowser family!
Warmest Regards,
The MarketBrowser Team
 |
|
PS. Please help us improve these tutorials!
Take 3 minutes to tell us what you thought...