Back-Test Your Strategies Quickly & Easily With Conditional Analytics™

Why Wait?
MarketBrowser AE users get:
- Up to 100 Simultaneous Live Charts
Monitor up to 100 stocks & studies in a single display! - Advanced Analytic Tools
Loaded with over 750 studies and functions!! - Instant Global Research
Just click on a chart & instantly pivot to hundreds of the best financial news, commentary & information sources! - mSheet™ Live Investments Scorebox
Create dynamic spreadsheets that summarize key numbers & calculations by pulling them straight from your live charts - Back-Test with Fast & Easy Tools
Use Conditional Analytics™ to create complex 'if-then' scenarios as you develop & evaluate your trade strategies - Trend-Lines & Text
Use the Drawing Toolbar to add custom trendlines, highlight areas of interest, apply text notations, & more - Stocks, Funds, Forex, ETFs, & Metals
Extensive NYSE, AMEX, & NASDAQ stock coverage plus economic, mutual fund, currency, ETF, & metals data
Contact Our Sales Team
Only $2,995 per year for
a 6-pack of "Everywhere" Licenses!
Conditional Analytics™
Develop complex 'if-then' and 'what if' scenarios to develop, evaluate, & back-test your investment strategies with NEW MarketBrowser AE Conditional Analytics™—all for only $2,995 per year for a 6-pack of "Everywhere" Licenses!

Menu Driven Conditional Analytics
MarketBrowser AE makes it extremely easy to view and test market micro-conditions, from the simplest "If/when" and "If/then" conditions, to the most complex, multi-instrument, multi-expression conditions you can imagine. Use these menu-driven capabilities to evaluate investment, trading and risk exposure strategies, subject to your chosen performance metrics and constraints. Back-test your strategies -- and drive them into the future using MarketBrowser's random-walk facilities
With MarketBrowser AE's Conditional Analytics, simple or complex conditions among your chosen instruments, indicators and custom equations, can be co-mingled with single- or multi-series conditions to visually, identify and mark each instance when your chosen conditions are met, and to drive a trade or investment simulation -- from the simple to the highly complex. Easily mark each instance when your test conditions are all met on a graph of the security of interest, then use these marks to trigger buy/sell signals as a series in a new window upon which you can perform even more sophisticated analytics. Buy/Sell signals are not limited to movements within the series under study, but can be triggered by any combination of market events, involving any combination of instruments or other time series which you choose. Your analysis will be so deep, you'll practically Be Omniscient—Guranteed.
- Calculate a security's profit & loss over time based on possible buy/sell strategies
- Backtest new and existing trade strategies - quickly, easily and efficiently
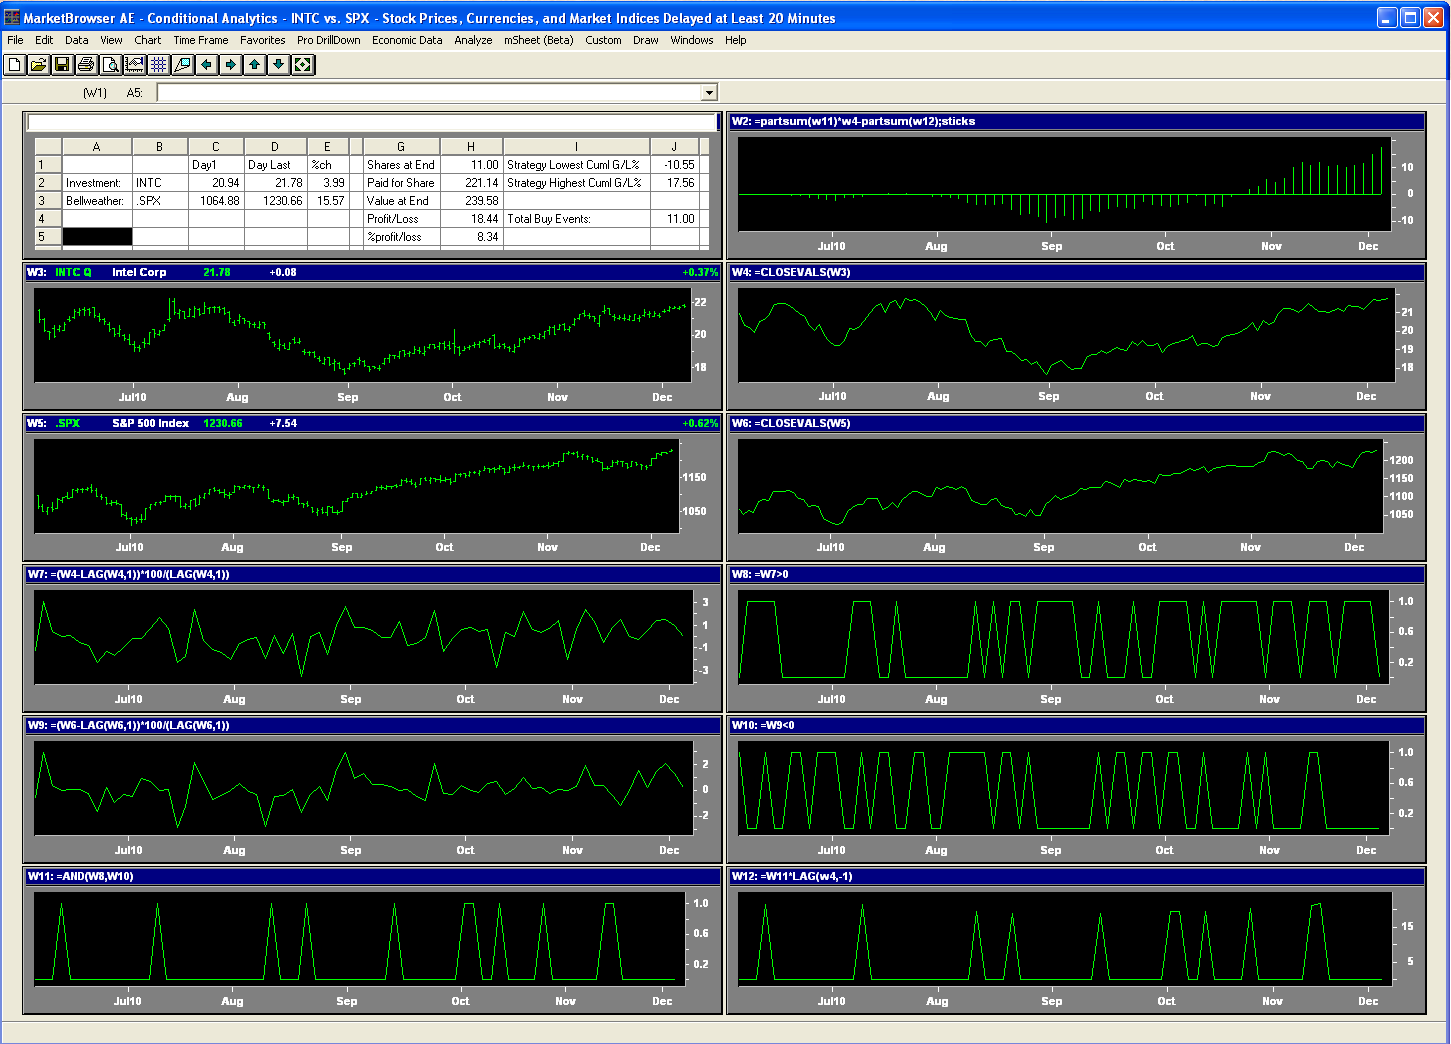
MarketBrowser AE - click to enlarge
How does MarketBrowser AE give users the ultimate in flexibility to apply Conditional Analytics to investing decisions?
Here's an example. In the worksheet above (you may click it to zoom up your view), a strategy is depicted for investing in a primary security, in this case, INTC, when it shows a price uptick on days when a broader market indicator -- is moving negatively. Here is a narration of this worksheet by relevant Window number (windows W1 and W2 are discussed at the end as these contain the summary performance statistics.)W4: 6 month history of closing prices of INTC
W5: 6 month hisotry of SPX
W6: 6 month history of closing prices of SPX
W7: Daily percent change in INTC Close
W8: a zero/one series showing days when the percent change in INTC exceeds zero
W9: Daily percent change in SPX Close
W10: a zero/one series showing days when the percent chagne in SPX is negative
W11: A zero/one series showing days when INTC percent change is positive and SPX percent change is negative. This is the buy strategy we are testing. That is, buy on those occasions when INTC went up while the SPX went down the prior day.
W12: the actual purchase prices using a single-share buy rule, buying that single share when W11 shows a one value.
W1: an mSheet utilized to depict a scorebox of the performance of this strategy. Note that this mSheet's stats are of course driven by the data in the various windows of this worksheet.
W2: The cumuative profits or losses of the strategy.
Contact Our Sales Team Now
Only $2,995 per year for a
6-pack of "Everywhere" Licenses
Have you been overpaying for your essential tools?
Many firms are spending up to $1500 per employee per MONTH on expensive institutional terminals for their employees. Maybe your organization should consider spending a fraction of that, while still filling your team's needs. For 20 years, Leading Market Technologies has worked with the world's top investment firms to create best-of-breed software for researching, analyzing, & monitoring securities. By 2001, our solutions were being used by over 80% of the world's large banks and investment banks. Now this expertise has been packed into new, easy to use, affordable MarketBrowser AE—making investment research & analysis easier than ever before. For years, you've felt like you needed to pay exorbitant fees to stay competitive. Now MarketBrowser AE puts the ball back in your court for only $50 per employee per month. Slash expenses without sacrificing quality today.