Conditional Analytics™
Develop complex 'if-then' and 'what if' scenarios to develop, evaluate, & back-test your investment strategies with NEW MarketBrowser AE Conditional Analytics™—all for only $2,995 per year for a 6-pack of "Everywhere" Licenses!
What are They & How Do They Help Me?
Conditional Analytics are a unique new way to quickly and easily:
- Back-Test New & Existing Trade Strategies
- Develop New Tactics
- Evaluate & Optimize Trade Rules
- Compare Alternative Trade Philosophies
Check out the example below to see how we back-test a potential trade strategy. This entire analysis takes only moments to build as MarketBrowser AE's unique, new, menu-driven conditional analytics™ make evaluating decisions quick & easy!
Example: Back-Testing With MarketBrowser AE
The Challenge:
Back-Test a mean reversion trade strategy with Google as a target stock and these trade rules:
- BUY RULE:
Days where Google's price is LESS than prior-day price MINUS 1/2 the volatility index
- SELL RULE:
Days where Google's price is GREATER than prior-day price PLUS 1/2 the volatility index
The Solution:
(Approx. 5 minutes to build this analysis)
Back-test this strategy in only 6 steps with MarketBrowser AE's simple menu-driven tools. See the Full Display followed by the step-by-step construction of the analysis below:
Full Display - This is what your full Back-Test will look like
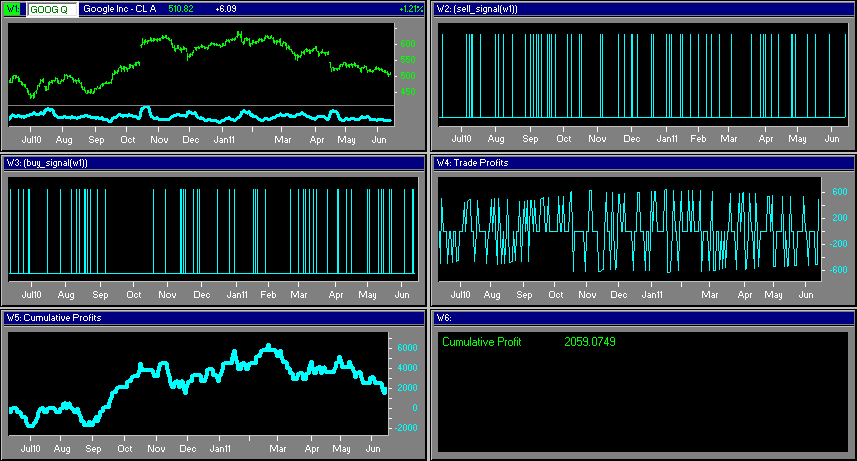
Final Analysis (above): Here are the final results of back-testing a potential trade strategy targeting google. Below is a step-by-step breakdown which shows how we used simple MarketBrowser AE tools to create this analysis in 6 steps.
Step #1 - Google Price & Volatility (Upper Left Window)
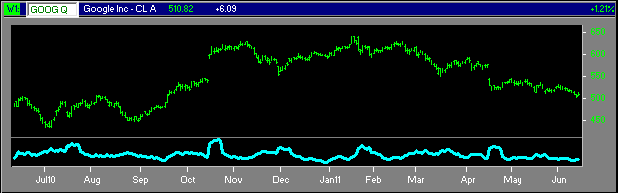
W1 - Google Volatility: Here we've charted Google's Stock Price in green and then used the technical study menu to over-lay its volatility index (with a boxcar of 6) in the cyan line below it.
Step #2 - Triggered Sells(Upper Right Window)
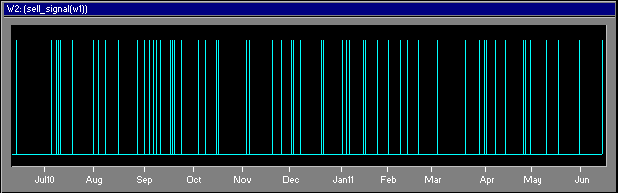
W2 - Selling Rule: In Window 2 we chart our conditional sell signals. In this example we sell on days when the current price is greater than yesterday's price plus 1/2 the volatility index.
Step #3 - Triggered Buys (Middle Left Window)
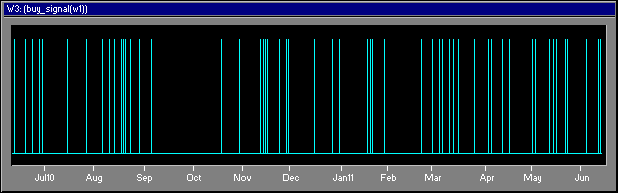
W3 - Buying Rule: Here we've charted our conditional buy signals. Each bar marks a day when our buy rule is triggered (current price is less than yesterday's price minus 1/2 the volatility index).
Step #4 - Per Trade Profits & Losses (Middle Right Window)
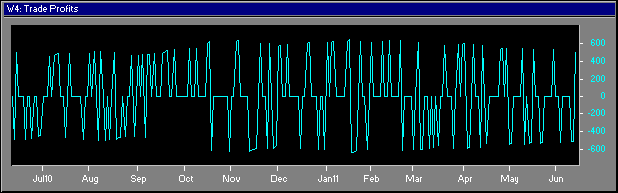
W4 - Profits/Losses: Now things are getting interesting! Window 4 pulls & charts profits and losses for the Sells triggered by Window 2 and the Buys triggered by Window 3.
Step #5 - Cumulative Profit & Loss (Bottom Left Window)
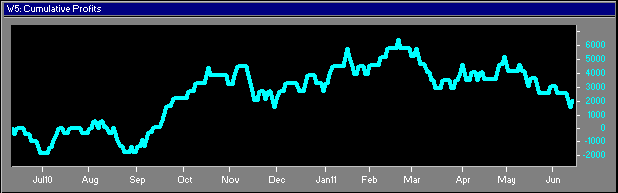
W5 - Cumulative Profit: Here's the payoff. In Window 5 we total the individual trade results to generate a running total for the cumulative profit and losses over time that would have resulted from our potential trade strategy.
Step #6 - Your Current Profit or Loss
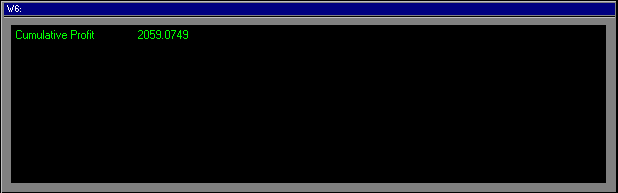
W6 - mSheet™ Investment Scorebox: Here we're using MarketBrowser AE's mSheet™ to pull a current (LIVE) result from Window 5 ($2059 cumulative profit!). This number will update as data changes. Note: although we're tracking only 1 number here, mSheet can hold hundreds of live stats at a time! Read more about mSheet here!
Final Display - Live Back-Test Analysis!
Final Display: Keep it all on a single display. Your complete back-test analysis—with automatically updating charts & analysis—all fits into a single desktop display!
Back-Test with Conditional Analytics™ & More - Contact Our Sales Team Now
That's Just The Beginning
MarketBrowser AE is fast, easy, and effective! Now that you've made this easy back-testing analysis, with just a few clicks you can easily adjust it:
- Replace the Google Stock with other tickers
- Vary the time-period being tested
- Alter conditional trade volumes triggered by the trade rules
- Greatly increase the sophistication of your trade conditions
- Read more about MarketBrowser AE's Advanced Conditional Analytics here!
Contact Our Sales Team Now
Only $2,995 per year for a
6-pack of "Everywhere" Licenses
Have you been overpaying for your essential tools?
Many firms are spending up to $1500 per employee per MONTH on expensive institutional terminals for their employees. Maybe your organization should consider spending a fraction of that, while still filling your team's needs. For 20 years, Leading Market Technologies has worked with the world's top investment firms to create best-of-breed software for researching, analyzing, & monitoring securities. By 2001, our solutions were being used by over 80% of the world's large banks and investment banks. Now this expertise has been packed into new, easy to use, affordable MarketBrowser AE—making investment research & analysis easier than ever before. For years, you've felt like you needed to pay exorbitant fees to stay competitive. Now MarketBrowser AE puts the ball back in your court for only $50 per employee per month. Slash expenses without sacrificing quality today.
Contact Our Sales Team